
0SPX AutoTrades · Market Commentary
The Market Perspective
Understanding the Correction, What We're Watching, and Why There May Be Reason for Optimism
First, Let's Put the Market Decline Into Perspective
We've seen quite a bit of selling pressure in the Nasdaq over the past couple of months, and I think it's worth taking a closer look at what's happening, why it's happening, and where things stand.
To put things into perspective, the Nasdaq futures market has experienced a measured decline of approximately 16.75% from its October highs to its November lows. That's a significant correction, and naturally, we've seen this reflected in the trading environment as well.
One thing I want to point out is that markets go through different cycles. There are periods when the market trends relatively cleanly, and there are periods when it becomes more difficult to trade. We're currently dealing with the latter.
But before looking at what this means for our strategies, I want to touch on why we're seeing this correction in the first place.
What's Behind the Recent Sell-Off?
A significant part of what's happening right now has to do with artificial intelligence and the enormous amount of investment that's been flowing into the technology sector.
Over the past couple of years, we've seen tremendous enthusiasm surrounding AI. Companies have been investing billions of dollars into data centers, semiconductor chips, computing infrastructure, and everything else needed to support this next generation of technology.
That enthusiasm helped drive technology stocks, particularly those heavily represented in the Nasdaq, to considerable highs.
However, investors are beginning to question whether the enormous amounts being spent on AI infrastructure will generate the returns necessary to justify those valuations.
We're also seeing concerns about the pace of data-center expansion, regulatory scrutiny, and the financing costs associated with these massive infrastructure projects.
In other words, investors are reassessing expectations.
I think it's important to distinguish between what's happening in the market and the long-term potential of the technology itself. This isn't necessarily a reflection of AI failing or the technology losing its importance. It's more about investors reassessing how much they're willing to pay today for what they believe those investments will produce tomorrow.
We've seen this type of behavior in markets before. When expectations get ahead of reality, eventually there's a period of adjustment.
And that's essentially what we're watching unfold.
Why a Market Decline Can Actually Be Exciting
Now, here's where I want to offer a slightly different perspective.
While nobody enjoys watching the market decline, I don't necessarily view a correction of this magnitude as something we should automatically be concerned about. In fact, there are reasons to be encouraged by what a substantial correction can create.
Think about it this way. When markets continue climbing, they eventually reach levels where valuations become stretched and the potential for further upside becomes more limited.
A meaningful correction changes that equation.
It creates distance between current prices and previous highs, potentially opening the door for a much more substantial recovery.
More importantly, we're beginning to identify some important technical levels that give us something tangible to watch.
Rather than simply wondering when the market might turn around, we have an actual reference point to monitor.
That's what makes the current situation interesting.
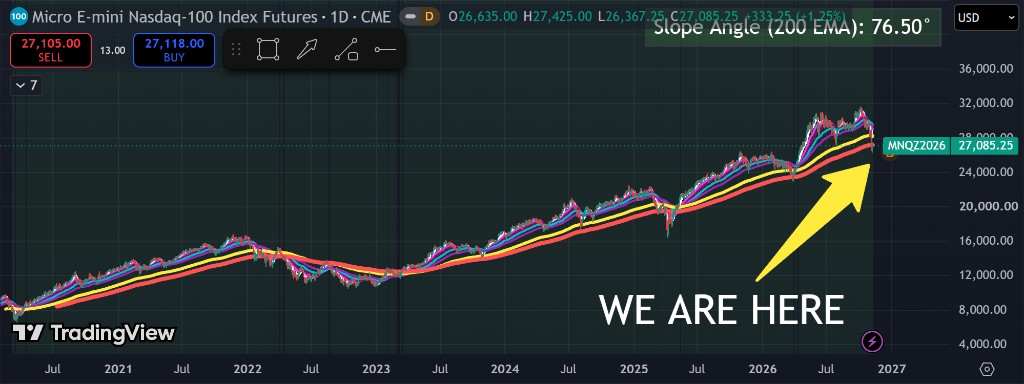
Before we zoom into the recent measured move, it helps to step back and look at where we are in the bigger picture. On the longer-term daily chart, the multi-year uptrend is still intact, and after this correction price is sitting near important long-term averages. That's the context I want you to keep in mind as we look at the shorter-term measurements next.
An Important Level We're Watching: The Daily 300 EMA
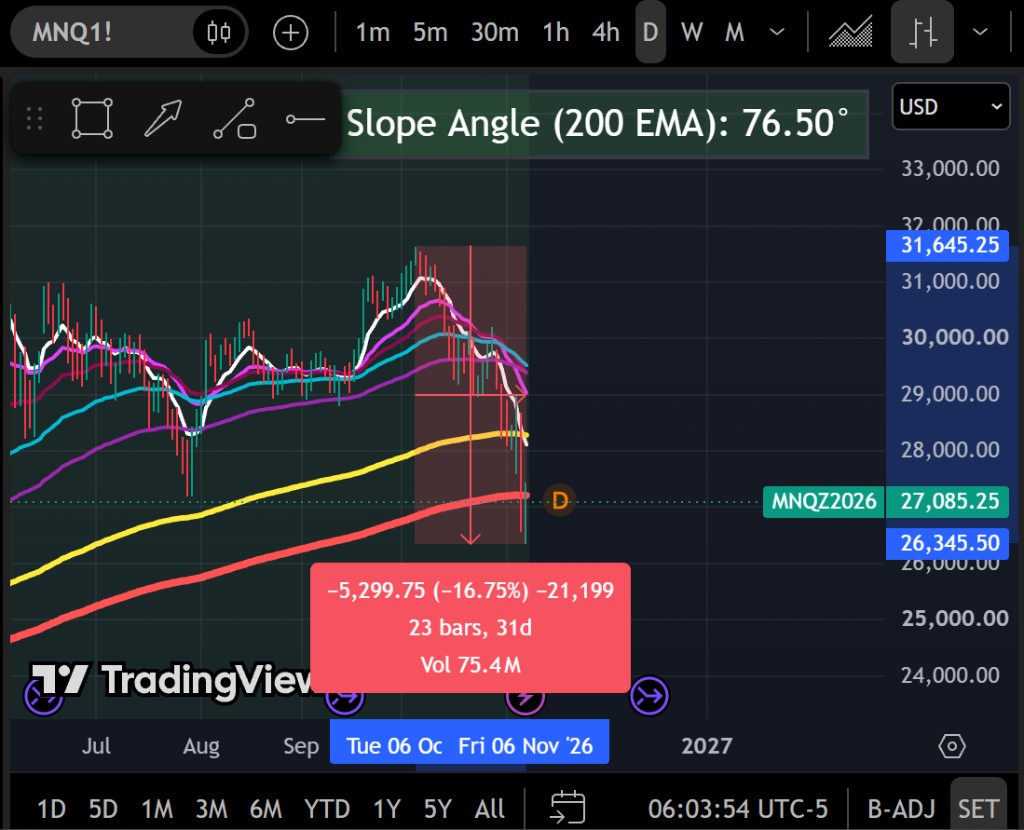
As illustrated in the decline chart below, the Nasdaq futures market has experienced a measured decline of approximately 5,300 points, representing a 16.75% drop over just 23 bars, or roughly 31 days. That's a substantial correction in a relatively short period of time.
The measured move runs from a starting high near 31,645.25 down to an ending low near 26,345.50.
One area I'm paying particular attention to right now is the daily 300 EMA.
As you can see in the chart, the Nasdaq is approaching this longer-term moving average, which could become an important area for the market.
Longer-term moving averages are particularly interesting during corrections because they give us identifiable areas where buying interest could begin to develop.
And that's important because it gives us something to gravitate toward, rather than simply trying to guess where the market might eventually find a bottom.
What Could the Recovery Look Like?
Now let's look at the other side of the equation.
The recovery chart below illustrates a potential recovery of approximately 4,471.75 Nasdaq points, or 16.48%.
Consider what that means.
Following a correction of this magnitude, we're looking at a potential recovery that would bring the market back toward its previous highs.
That's the part I find particularly interesting.
We've identified an important technical area to watch, along with a measurable upside objective. From a start near 27,140.50, the illustrative target sits near 31,612.25, spanning about 50 bars, or roughly 76 days on the chart.
This is why I think it's important not to look at market declines exclusively as negative events. Sometimes, these corrections are exactly what create the conditions for the next meaningful move higher.
And if that recovery develops, our algorithms will have opportunities to participate in whatever portion of that movement their respective entry and exit conditions allow.
We're not trying to predict every move or capture the entire recovery. We're allowing our strategies to identify and participate in opportunities as market conditions evolve.
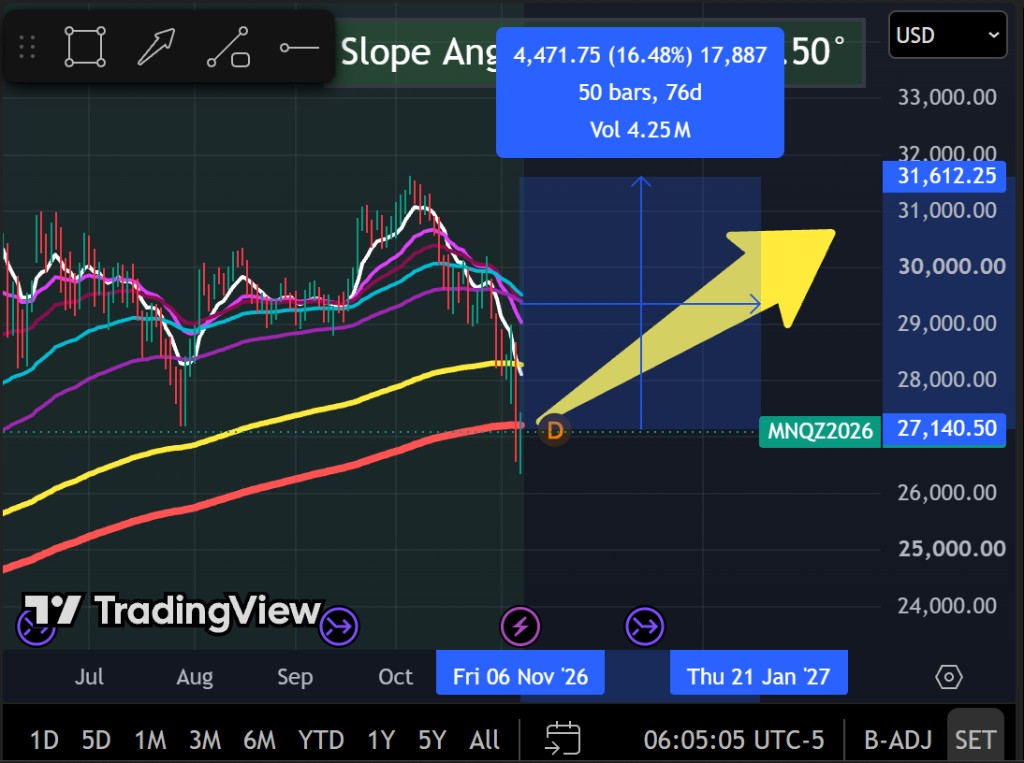
That recovery illustration also has a clear contract-level reading. Micro E-mini Nasdaq-100 futures (MNQ) are valued at $2 per index point per contract. Against roughly 4,500 points of potential upside, the math is straightforward: 4,500 points × $2 per point = $9,000 per contract, or $18,000 at two contracts, in potential gross profit before commissions, fees, and slippage. (These figures are illustrative only. They do not assume the algorithms capture the full move, and they should not be read as a forecast or expected return.)
If you've been sitting on the sidelines, or haven't found the success you were looking for trading or investing on your own, you're welcome to join 0SPX AutoTrades. Let the algorithms work these kinds of setups, so you don't have to navigate them alone.
How Our Algorithms Approach These Market Conditions
One thing worth understanding about our approach is that we're not trying to predict when the market will reverse or position ourselves ahead of a potential recovery. Our algorithms are designed around trend-following principles.
They look for specific EMA alignments and market conditions before identifying trading opportunities. In other words, we're allowing the market to establish its direction rather than trying to guess what comes next.
This is particularly relevant during periods like we're experiencing now. When markets become choppy or lose directional consistency, trading conditions can become more challenging. But as trends begin to develop and the required moving averages align, our algorithms are designed to identify those opportunities and participate accordingly.
That's why a potential recovery is interesting to us. We're not betting on a reversal. We're interested in what happens when the market establishes a trend that our systems can recognize and trade.
What Does This Mean for Your Account?
I also want to address something that I know is important to everyone following our strategies.
Not every investor will experience the same drawdown, and that's largely a reflection of the different configurations available.
Depending on your current preset, scaling parameters, and individual risk tolerance, your account may be experiencing a drawdown roughly in line with the broader market decline, while others may be slightly above it.
There isn't one universal performance figure that applies to everyone. Your selected configuration plays an important role in determining how your account responds to different market environments.
This is also why it's important to understand the risk parameters you've selected and evaluate your results within that context.
A more aggressive configuration will naturally behave differently from a more conservative one. Neither should be evaluated without considering the underlying exposure and risk settings.
The important thing is understanding what you're running, why you've selected those parameters, and what to expect during different market conditions.
Looking Ahead
I think it's important to keep things in perspective.
We've experienced a significant correction, but we've also reached a point where there are some interesting technical developments worth watching.
We have a substantial decline behind us, a major long-term moving average approaching, and a potential recovery scenario that could represent meaningful upside if the market finds its footing.
That's why I don't necessarily look at the current environment with a negative outlook.
What I find encouraging is that we're beginning to see some important levels come into focus. After a correction of this magnitude, the potential for a meaningful recovery becomes increasingly interesting, particularly with the daily 300 EMA approaching as a key technical reference point.
This is exactly why I think it's important to look beyond the immediate decline and consider what could develop from here. There is now a measurable opportunity in front of us, and it's something worth paying attention to.
We'll continue monitoring these levels and allowing the strategies to operate according to their respective parameters.
For those of you who are comfortable doing so, it may also be worth considering whether adding capital ahead of this next phase makes sense for your situation. Additional capital can give you more flexibility around contract sizing and help you participate more fully if a sustained recovery develops, while we continue to emphasize disciplined risk management. There's no pressure either way. It's simply an option worth reflecting on as these levels come into focus.
Sometimes the best opportunities develop after the most difficult periods. The key is understanding what you're looking at, remaining patient, and being prepared when conditions begin to change.
As always, our focus remains on disciplined execution, managing risk, and allowing the strategies to do what they were designed to do.
Important Information
This material is provided for informational and educational purposes only. It does not constitute an offer, solicitation, or individualized investment advice. Futures trading involves substantial risk and is not suitable for every investor. Past performance and historical chart measurements do not guarantee future results. Technical levels may fail, and losses can exceed expectations. The recovery scenario and potential profit illustrations discussed are illustrative and should not be interpreted as a forecast or expected investment return.