
0SPX AutoTrades · Market Commentary
The Market Perspective
Navigating volatility, preserving capital, and watching for signs of stabilization.
A difficult stretch for the broader market
Markets have been challenging lately. Selling pressure across the Nasdaq has repeatedly interrupted attempted recoveries, making it difficult for the market to establish sustained upward momentum. That kind of back-and-forth can create headwinds for systematic strategies, even when they are designed to operate across different market environments.
The important point is to assess the environment clearly: volatility and drawdowns are part of market cycles, and risk management matters most when conditions are less favorable.
Measured Nasdaq decline
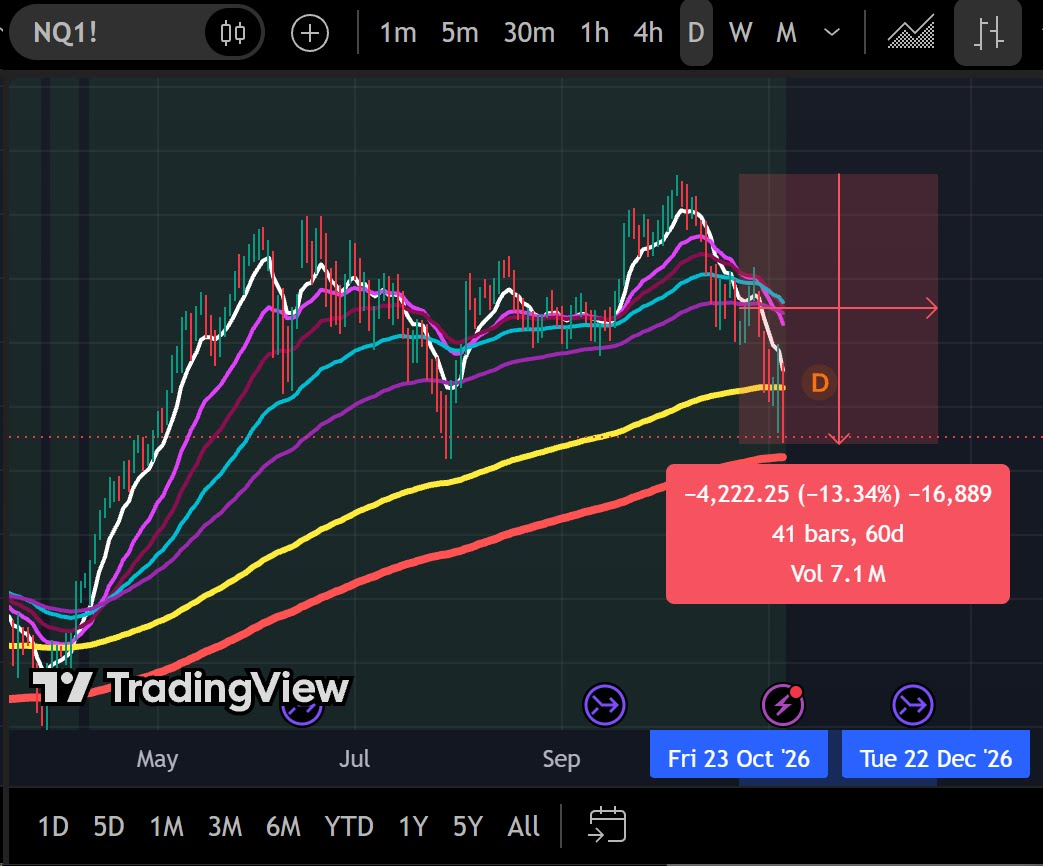
Shown in supplied chart
Points lost in the measured move
41 bars, 60 days
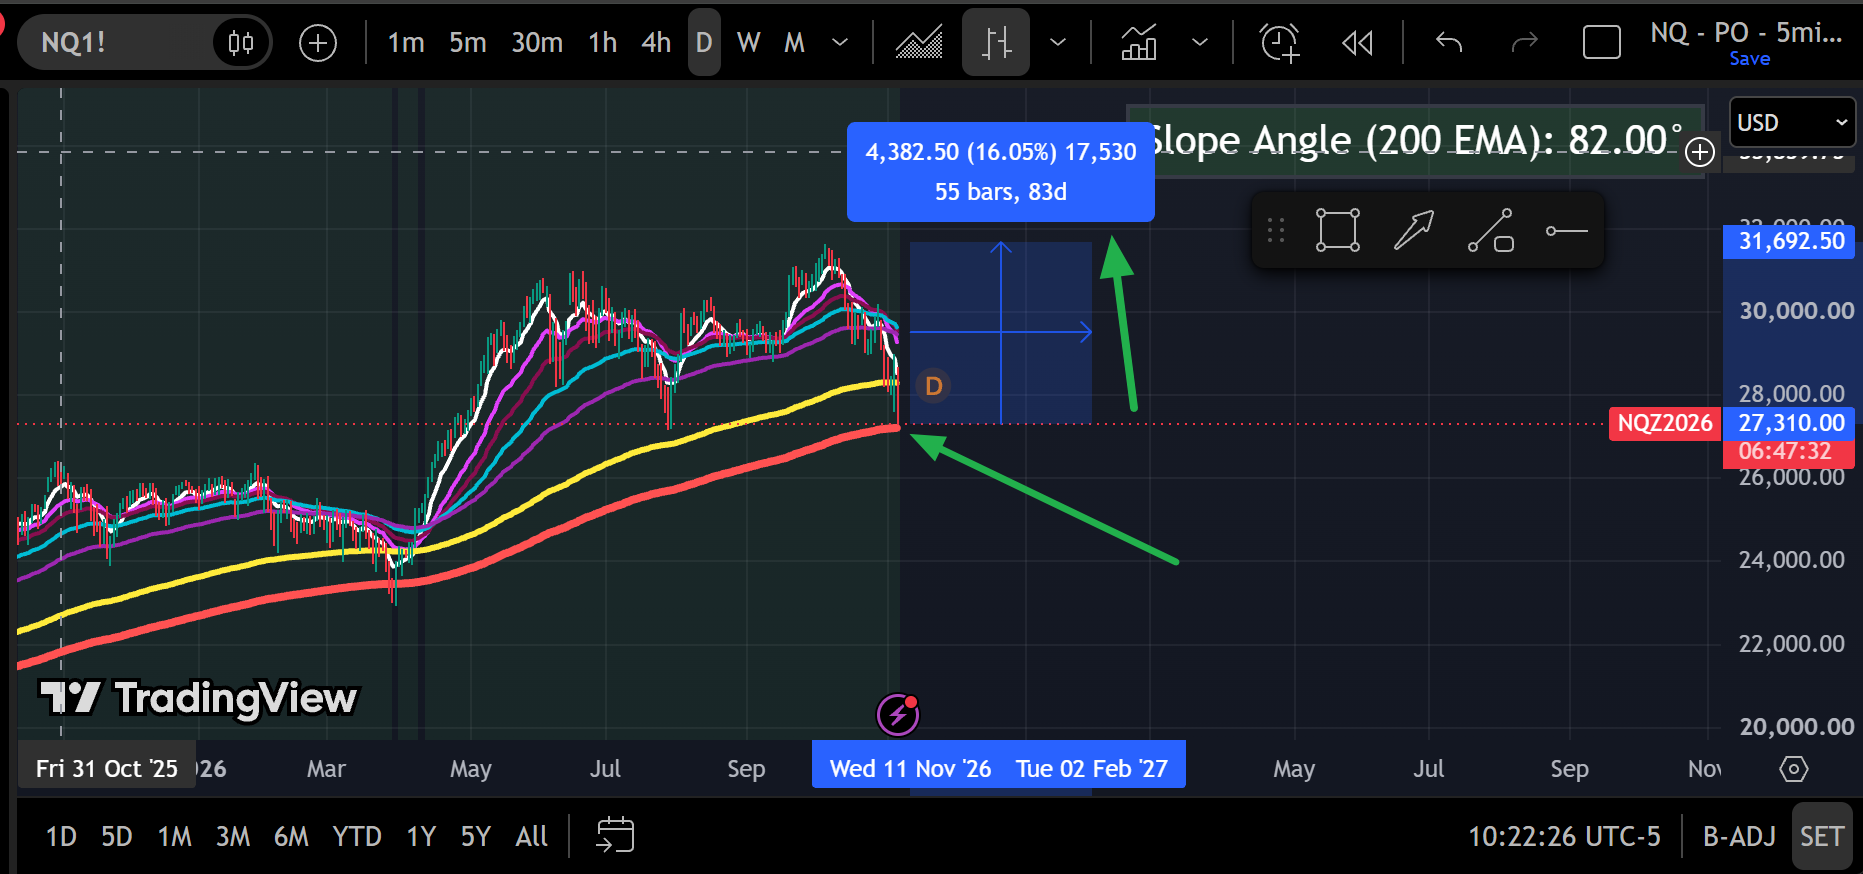
Illustrative bounce measurement
+16.05% on the supplied chart
The chart measurements are historical/technical illustrations from the supplied TradingView screenshots. They are not predictions or assurances of a future market move.
The decline, and the level we're watching
The supplied chart measures a decline of approximately 4,222 Nasdaq points, or 13.34%, over 41 bars and 60 days. Price is now approaching a major long-term moving-average area around the 300 EMA. This is a level worth monitoring, but support is never guaranteed. The market may stabilize, consolidate, or continue lower.
The potential bounce play
If price holds near that long-term moving-average area, a bounce becomes the scenario to watch. The second chart measures an illustrative upward move of approximately 4,382.50 Nasdaq points, or 16.05%. That is a technical chart measurement of a potential recovery path from the recent low area, not a forecast, target, or expected strategy return.
If the market does find support and begins to recover, the algorithms may participate in part of that move, subject to their entry and exit rules, position sizing, and prevailing market conditions. We should not assume the strategies will capture the entire 4,382.50-point measurement, or that a bounce will follow immediately.
Understanding MNQ point value
Micro E-mini Nasdaq-100 futures (MNQ) have a value of $2 per index point per contract. At one to two contracts, that is $2-$4 per point of gross position movement. For example, a 100-point move equals $200-$400 before commissions, fees, slippage, and the actual results of the strategy.
Why patience matters. We cannot control the market's direction, but we can remain disciplined about how strategies manage exposure. The focus remains on measured execution, risk controls, and navigating changing conditions rather than chasing every short-term move.
Looking ahead
Our focus remains disciplined execution, risk management, and capital preservation. We will continue monitoring the market's response around important technical levels and allow the strategies to operate according to their defined parameters. There will be periods of drawdown, consolidation, and recovery. The priority is to manage through each environment thoughtfully.
Important information: This material is for informational purposes only and is not an offer, solicitation, or individualized investment advice. Futures trading involves substantial risk and is not suitable for every investor. Past performance and chart measurements do not guarantee future results. Technical levels may fail, and losses can exceed expectations. MNQ dollar examples illustrate contract point value only and exclude transaction costs.